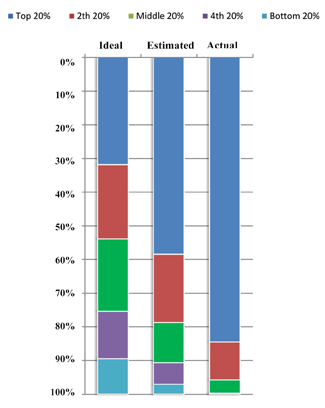
The Actual United States Wealth distribution plotted against what respondents in the “Building a Better America” study said was respectively their Ideal and their Estimated wealth distribution. (As the authors note, because the bottom 40% of Americans have a share of wealth so small—0.2% for the 4th quintile and 0.1% for the 5th quintile—they can’t be graphically represented by the Actual distribution chart.) I’ve rotated the chart, which is presented horizontally in the study, because to me it more accurately represents the top-to-bottom reality we face.
|
| Read the full study here |
The point is this: respondents across demographic categories simultaneously want a more equitable distribution of wealth in the U.S. and think that wealth is more equitably distributed than it really is. Our situation—the result of three decades of conservative economic policies and ideologically manufactured “facts” from conservative think tanks—really is dire. So, when you hear the word “conservative,” remember that conservatives are those whose policies aim to “conserve” the status quo. And if inequity is your cup of tea, vote conservative!
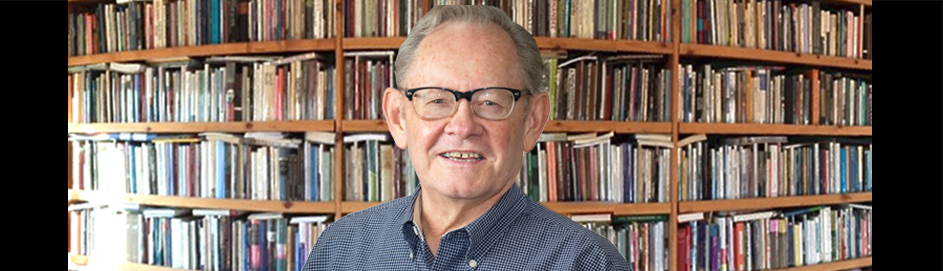
 Joseph Hutchison, Colorado Poet Laureate 2014-2019, has published 20 collections of poems and edited or co-edited three poetry anthologies. He currently directs two master’s-level programs for University College at the University of Denver: Professional Creative Writing and Arts & Culture Management. Joe lives with his wife, Melody Madonna, in the mountains southwest of Denver, Colorado, the city where he was born.


